Further development and extension of X-Ray Diffraction Laminography
In the last years, X-ray diffraction laminography (XDL) has been developed at IPS/KIT for the 3D imaging of defect structures in crystalline samples [Hänschke 2012]. It was successfully applied to weakly absorbing materials like silicon (Si) to capture complex arrangments of dislocations in 3D.
Within the STROBOS-CODE project, the partners were aiming on extending the basic methodology by correlative measurement and analysis procedures, see Fig. 1. By combining XDL with complementary methods a comprehensive characterization of crystalline defects and the associated lattice strain can be obtained, e.g. linking the 3D structure (on the mesoscopic length scale between micrometers and millimeters) of dislocation patterns to microscopic aspects like the Burgers Vector distribution.
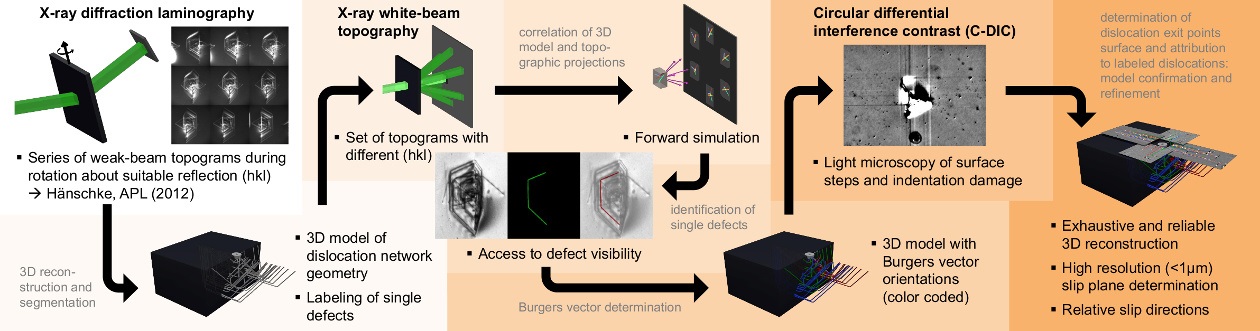
The basic principle of XDL is similar to conventional computed tomography: A set of 2D projection images is recorded from different view directions. To take advantage of Bragg diffraction contrast it is crucial to rotate the sample about a selected reciprocal crystal vector. Suitable reconstruction algorithms then provide a 3D picture of the investigated crystal volume. In order to extend XDL with time-resolving in situ capabilites, a sufficiend speed-up of the measurement procedure is key. Within STROBOS-CODE this has been achieved by the development, implementation, and optimization of dedicated instrumentation and reconstruction algorithms.
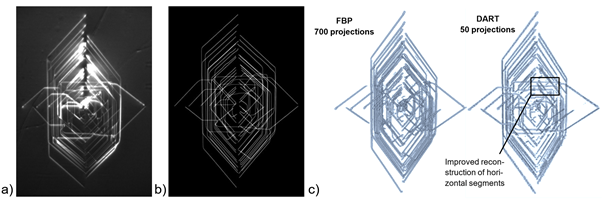
Recently, for example, the number of projection images required for successful 3D reconstruction could be considereably reduced: While for the conventional reconstruction techniques like filtered back projection about 700 projections within a 130°-angle range were necessary to achieve a sufficiently accurate 3D reconstruction of a complex dislocation network, applying adopted algebraic reconstruction techniques (e.g. DART) the required number of projections could be reduced to 50, meaning a speed-up by a factor of 14, see Fig. 2. This speed-up enabled new measurement schemes, e. g. capturing the nucleation, generation and propagation of dislocations by performing a gradual annealing of the sample alternating with XDL-scans. This makes it possible to image the evolution of dislocations into complex structures with a spatial resolution on the micrometer scale in crystal volumes of several mm3 of size.
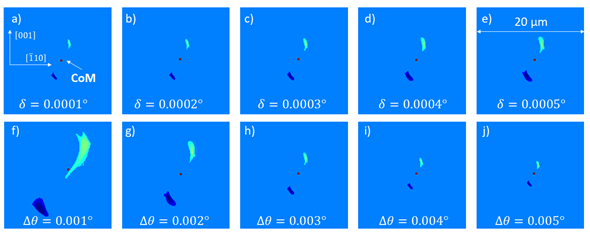
Furthermore, a theoretical framework for the image contrast formation in XDL-projections was developed, tested and analyzed. The contrast formation model takes into account, that the dislocation's position indicated by a given projection is depending on the respective view direction since the illuminated crystal volume is not at the position of the dislocation but a region of the distorted lattice in vicinity of the dislocation. As a consequence, the reconstructed dislocation feature is also not coinciding with the position of the dislocation core. Simulations show the influence of measurement paramaters, like the so-called "Bragg-deviation" or "weak-beam parameter" Δθ and the angular beam dispersion δ, on this shift and allowed developing an approach to enhance the spatial resolution of XDL by a few µm. By reconstructing two projection sets with opposite few directions of the same dislocation arrangement two results are obtained, which can then be correlated to determine the position of a dislocation's core with higher accuracy, see Fig. 3.